![]()
Ecommerce Business Idea Checker
Is your business idea viable?
The Idea Checker tool is useful if you have an idea for a product you’d like to sell online and you want to check if it’s viable. It’s also useful if you already have a product you’re selling wholesale and you just want to check the viability of selling direct to consumer.
So you’ve got your great idea for a new eCommerce business and what we’re going to be doing today is running through some of the numbers that contribute to your business success.
Running an eCommerce business isn’t as easy as some people make out and can actually be quite expensive.
There are a lot of costs that sometimes we don’t think about or we underestimate
We’ve got a spreadsheet tool here that we’re going to be running through to see how much money you have in your pocket after all these costs have been considered.
I’m going to walk us through this tool and we’re going us our fictional coloring book brand to see how things stack up.
Benchmark against proven businesses
Column C shows percentage benchmarks that we know work well and we’re going to use them as kind of a thermometer and compare them with our business results in column B.
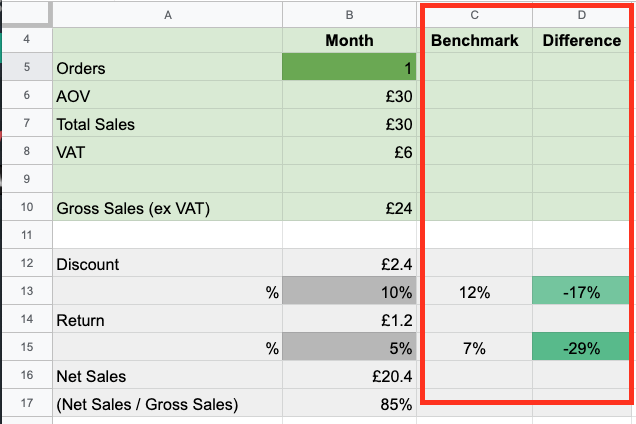
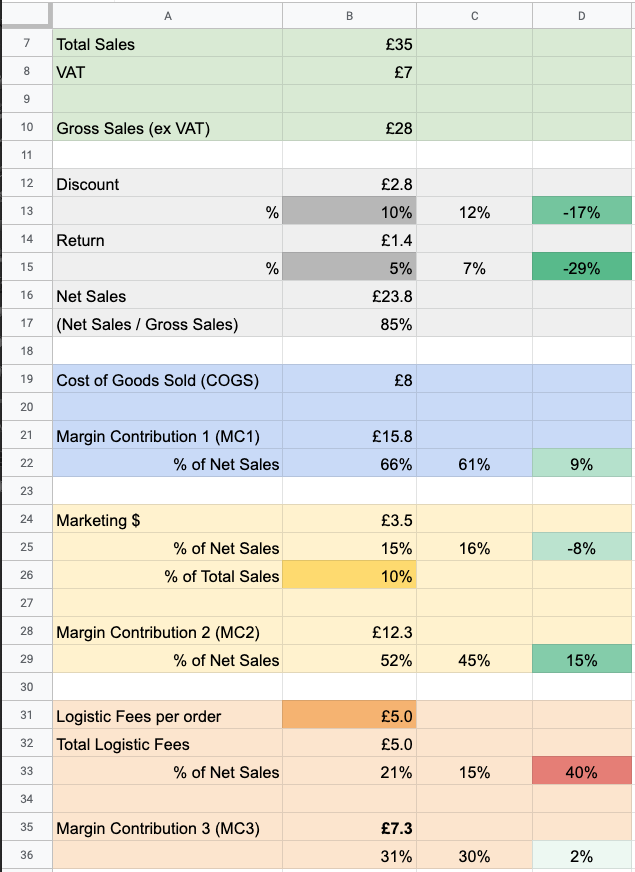
Work off Gross Sales (excluding VAT)
Let’s We have orders, average order value, which is based on G8, which make our total sales.
Of that, at least in the UK, we’re going to be paying 20% VAT so that’s money that we don’t get.
Now, if you’re in the U.S., the tax system is different to here in Eurpoe and so what we’re going to be basing this calculator on is the gross sales.
So we’re looking at revenue excluding VAT.
In our case, it’s the £30 minus the £6, leaving us £24.
So we’re basing everything on the £24.
Discounts and Returns
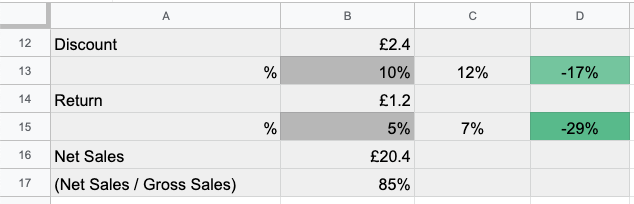
This is the part where we knock off some costs from our revenue – specifically returns and discounts
We’re going to start and put our discount here at 10%.
So that’s £2.40.
So this is money that we’re going to be giving off, for example, welcome offers, discounts on repeat purchases, sales and other promotions
Our benchmark is 12% with the caviat that this changes depending on your product and industry.
But in this case, we’re in a good range and the green cell represents that.
Next we’re looking at the returns rate, we’re selling coloring books so our returns rate probably aren’t going to be too high, but in any case, we’ve put 5% here just to be safe.
Now, if you are selling a product that has a higher likelihood of it being returned, like say clothing, then this could be anywhere up to, say, 20%.
If that’s the case for your business, then change it accordingly
But for this one, we’re going to keep it at 5%.
After doing these two step we are left with our Net Sales. So our net sales is our gross sales minus the discounts and minus the returns, leaving us £20.40, which as a percentage of Gross Sales is 85%.
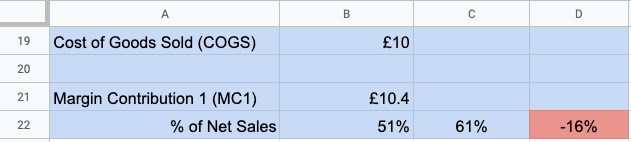
Cost of Goods Sold (Product Costs)
So the next section is looking at cost of goods sold or COGS, product costs in this section
The above section is populated by what enter in columns F through J.
You can add multiple lines for additional products if needed. The totals are added up at the bottom and are reflected in the blue COGS section above.
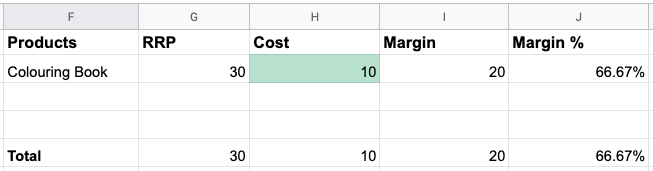
For the example, above we have an RRP or MSRP of £30 and our initial cost is £10
As you can see from the red numbers the COGS we’re going to have to review that!
Here’s how it works – the product costs us £10, our margin is £20.
As a percentage, this is 66%. The higher this number, the more margin we make from every order.
Now that we know this let’s subtract the COGS from the Net Sales which is
Net Sales of £20.40 minus
COGS of £10 equals
Margin Contribution 1 of £10.4
This leaves us under the target of 61% and we’ll need to work on some ideas to improve this.

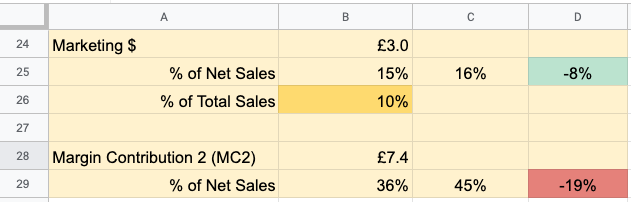
Marketing Costs
Before we solve any potential problems, let’s continue down the sheet and next up is marketing
The cell we’re going to be editing is B26.
We’ll be specifying a % of Total Sales that we’ll be spending on marketing.
Why Total Sales?
Total Sales is what is reported natively in Facebook and Google Ad Reports and basing our Marketing spend on this makes reporting way easier
I’m going to start with 10% here, which allows £3 per order
This isn’t a lot but we need to know that ideally, we’re not running paid ads to get every sale
Once the marketing spend has been set Margin Contribution 2 is calculated
It’s calculated by taking Margin Contribution 1, minusing off £3 for marketing, which leaves us £7.4, for Margin Contribution 2 which is 36% of net sales.
Our target is 45%. So again, we’re in the red. Let’s take a look at that after.
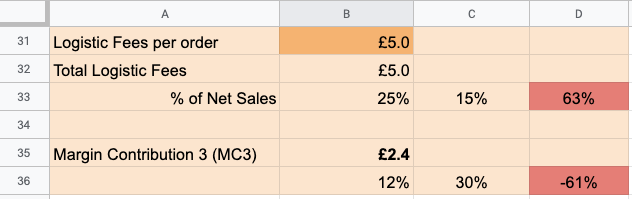
Logistics Costs
Finally, we’re onto logistics.
This includes picking, packing, credit card fees etc
We’re going to start by adding a value into B31 that is your average cost to fulfill one order.
This is going to be different depending on the size and weight of your product and how many orders you ship but for this example let’s start with £5 per order which as a percentage of Net Sales is 25% which is quite high.
Our targets 15%, so you can see where we’re way over there – again we’ll attack this shortly.
Let’s look at Margin Contribution 3, which is, if we look at the formula, Margin Contribution 2 of £7.40 minus the £5 leaves us £2.40 for Margin Contribution 3 which, as a percentage of our net sales, is 12%.
We’re way below the target of 30%.
So start to take a look at how we can fix some of these red cells here.
Fix #1 – Reduce Product Cost
The first port of call is to analyze the product cost
Right now, our margin is 66%, meaning we sell the product for £30 and it costs us £10.
So let’s try dropping this down to, say, £8 and see how this affects the numbers.
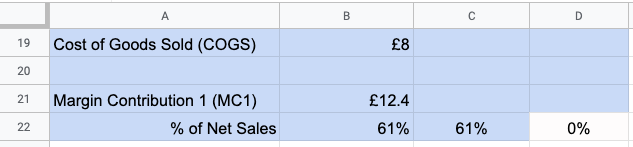
We’re flat against our target of 61%, great!
Next, let’s look at the red sections in the Logistics section.
As we can see, that as a percentage of net sales is 25%, which is too high.
So what we need to do is somehow get our average order value up to a point where this goes to the green so we’re making more money at the bottom there.
Fix #2 – Increase the Average Order Value
First let’s try increasing the retail price to £35
You can see we’re still in the red in Logistics, but our bottom line (MC3) is at 31%, which is actually pretty good and that’s helped by some of these bigger green numbers nearer the top of the sheet.
But what happens if we can’t increase retail price for some reason.
What we could do is try some upsells – add more products to the order.
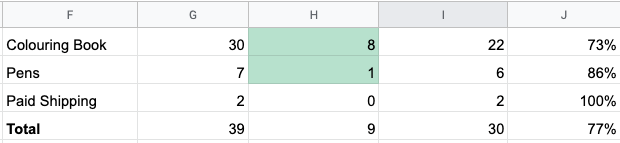
Let’s say we are selling some colouring pens to go with the colouring book.
Let’s say they cost us £1 and we’re selling them for £7.
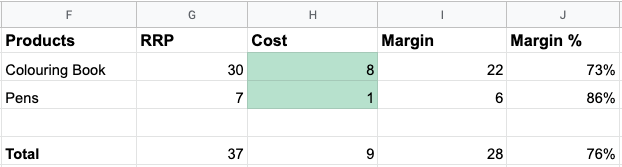
So what we can see here is that the colouring book margin is 73%.
The pens have a higher margin at 86%. So that brings the average total up to 76%
Below we can see that now with our average order value at £37 the logistics fees are having less of an impact on our bottom line

Fix #3 – Play with free shipping rates
This section isn’t included in the video – bonus content for you readers!
You can also add into your product list shipping fees that you charge to the customer.
It doesn’t have to be much but it can help offset logistics fees if you find that they are too.
This works particularly well for brands with lower average order values
But please be aware that additional shipping charges should be communicated to the customer before they hit the checkout or you can expect additional abandoned carts and a lower conversion rate.
To Conclude
Before you invest money into a new ecommerce venture, do yourself and your wallet / your investors wallet a favour and double-check all the numbers.
Doing so will allow you to press in with confidence into the joys / struggles / highs / lows of running an ecommerce business.
PS – If you’d like access to the tool we’ve ran through, stick in your email below and we’ll send it right over.